
Report
Child poverty Housing Social security Work Race and ethnicity
UK Poverty 2026
This report sets out the nature of poverty in the UK, and evaluates changes under the last Conservative-led Government. It also sets out the scale of action necessary for the current Government to deliver the change it has promised.
Written by: Joseph Rowntree Foundation – Date published: 27 January 2026
You are currently reading:
1. Introduction
- 1. Introduction
- 2. Summary of the latest picture
- 3. Poverty broadly flat, similar to pre-pandemic
- 4. No progress in reducing poverty under last Conservative-led Government
- 5. Poverty has deepened
- 6. Groups with unacceptably high rates of poverty
- 7. Poverty across the UK
- 8. Future prospects remain deeply worrying
- 9. What can be done?
- Note
- Appendix
- Acknowledgements
- How to cite this report
1. Introduction
This report studies a range of data sources and published insights to build a comprehensive picture of the current state of poverty across the United Kingdom (UK). We know poverty can lead to negative impacts at all stages of life, so it is critical to look closely at the available information to work out who is worst affected, determine how levels have changed over time, and to see what the future prospects are likely to be. For the first time, we have produced a data dashboard to allow users to interact with the key charts in the report. We intend to keep this up-to-date throughout the year. We are also publishing a forward look at potential poverty rates under a range of economic scenarios in parallel with this report.
Our Grassroots Poverty Action Group have summarised the last 20 years of poverty data in just 6 words: “Nothing’s changed? Everything’s changed. It’s worse”. We can now look at the position up to the 2023/24 financial year, just before the 2024 UK General Election and can start to evaluate changes under the last Conservative-led Government.
The evidence shows that progress on reducing poverty continued to flatline, continuing the trend which began just before the start of the financial crisis all the way back in 2005/06, with overall poverty being between 20% and 22% in every year since then. It happened to be 21% in 2023/24. This is in contrast with the continuous fall over the previous 8 years to 2004/05, which delivered a 5 percentage point fall in poverty.
Below is a summary of the key findings of the UK Poverty 2026 report.
2. Summary of the latest picture
Nothing’s changed?
On the surface, it might appear that nothing has changed. But persistently high poverty rates lead to worsening real-world outcomes. Just as evidence shows that the longer a family spends in poverty the worse the effects on that family, the longer we tolerate unacceptably high levels of poverty the worse it is for our country. The corrosive impacts of poverty on families — fatigue, hunger, stress and reduced connectivity — hamper both their participation in society and their scope to make a bigger economic contribution. Failure to address poverty can hold back economic growth itself.
Every year, we see the same groups disproportionately trapped in poverty, with disabled people, people from some ethnic minority groups, people in larger families and renters all experiencing elevated rates. We see that being in work vastly reduces the likelihood of being in poverty, but it is far from a guarantee. Part-time workers, self-employed workers and workers in the accommodation and, food services (hospitality) sector, and in the administration and support activities sector, all see comparatively high rates of poverty, while in-work poverty overall has been rising across time. Looking at benefit rates, we see they remain inadequate, with the basic rate close to destitution levels.
Everything’s changed — it’s worse
But scratch below the surface, there are signs of change: a definitive deepening of poverty. The deeper you go, the further away from the poverty line you look, the worse things are. In 2023/24, 6.8 million people — or almost half of those in poverty — were in very deep poverty, with an income far below the standard poverty line, meaning their incomes are at most two thirds of the poverty line. This is both the highest absolute number of people, and the highest proportion, on record, going back to 1994/95.
We will have new information on the extent of the deepest and most damaging form of poverty — destitution, where people cannot afford to meet their most basic physical needs to stay warm, dry, clean and fed — towards the end of this year, but we already know levels more than doubled between 2017 and 2022 (Fitzpatrick et al., 2023). We see further evidence of deepening poverty in the large increases in the number of people who are struggling to access enough nutritious and varied food, with the total number of people who are food insecure increasing by 2.8 million between 2021/22 and 2023/24 (a 60% increase in just 2 years).
Reasons for past trends and future prospects
Why is this the case? We think it is because of a lack of coherent focus on the issue, with policy interventions over the past 2 decades being fragmented, reactive and, in very many cases, actually worsening poverty rather than reducing levels. An improving labour market pre-pandemic did not feed into lower poverty levels, because benefits were being cut at the same time, deepening poverty. Low interest rates did not feed into lower housing costs because growing numbers of people were stuck in the expensive private rented sector. A decade of weak growth in real incomes meant families had precious little breathing space when first the pandemic and then the cost of living crisis hit, which in turn drove up numbers of people going without essentials and having often to rely on emergency charity like food banks. The bottom line is that piecemeal and often misdirected interventions, often in the form of basic cuts in support rather than investment, will never shift a system that is producing deepening poverty.
This is the background to the Government’s recent Child Poverty Strategy (Child Poverty Unit, 2025.) This does represent change, with Department for Work and Pensions (DWP) modelling predicting a reduction in headline child poverty by 400,000 over the Parliament (DWP, 2025a). Poverty modelling is always uncertain (see Tims et al, 2026 for JRF’s look at how poverty trends change under different economic scenarios), but if this comes to pass, it would represent the biggest fall in child poverty over a Parliament since records began in the early 1960s. Scrapping the 2-child limit sits at the centre of this strategy. It was the single most effective policy decision the Government could have taken to lift significant numbers of children out of poverty. Further measures are welcome too: making childcare more accessible to families on Universal Credit (UC) and reducing the need for temporary accommodation, alongside boosting family incomes through our social security system, will mean more children have a better chance at the healthy, happy childhood that they all deserve.
The magnitude of policy change is hugely welcome, but it is focused on just one part of the picture. Certainly, child poverty is in chronic need of attention: poverty levels for children are much higher than for working-age adults and pensioners (and have been for the last 40 years), but this leaves many other groups with persistently high levels of poverty overlooked. Indeed, some changes, especially cuts to UC for people who fall ill, will make poverty worse including for many parents, as will some of the stigmatising language used which blames people for being in difficult situations. Even after the Child Poverty Strategy measures, DWP forecast over 4 million children will be in poverty in 2029/30, and we still need to see action on the manifesto commitment to end the mass dependence on emergency food parcels.
Despite the welcome Child Poverty Strategy, there remains a seeming lack of urgency and sense of direction towards building the comprehensive set of actions to start a sustained downward trend in the headline rate of poverty, moving beyond a focus on child poverty. We need a comprehensive plan that addresses a much wider range of causes and consequences of poverty across all who are held back by hardship.
3. Poverty broadly flat, similar to pre-pandemic
More than 1 in 5 people in the UK (21%) were in poverty in 2023/24 — 14.2 million people. Of these, 7.9 million were working-age adults and 4.5 million were children. To put it another way, around 2 in every 10 working-age adults are in poverty in the UK, with about 3 in every 10 children being in poverty. Pensioner poverty is lower, but it still affects 3 in 20 pensioners. The picture compared to 2022/23 is one broadly of stability in terms of headline figures, but dig below this and worrying signs appear: this was the third consecutive rise in both the number and proportion of children in poverty, now up 600,000 on pandemic levels, while the small reduction in overall poverty was driven by falling average incomes causing the poverty line, which is pegged to average incomes, to reduce.
Time-series of poverty rates for pensioners, children and working-age adults
Source: Households Below Average Income, 2023/24, DWP • Data covers the United Kingdom from 2002/03, and Great Britain before then.
4. No progress in reducing poverty under last Conservative-led Government
Taking a longer view, we can now see that poverty was at 21% both when the Conservatives took power in the Coalition Government during the 2010/11 financial year, and in the last full financial year before the recent election. The last period of falling poverty was during the first half of the previous Labour administration (between 1999/2000 and 2004/05), but it then rose in the second half of Labour’s time in power.
In part, the lack of progress over the last 20 years reflects the series of hits to living standards that have affected the whole population. Each of the 5 Parliaments since 2005 has recorded lower quarterly income growth than the last 13 Parliaments before 2005, stretching back to the start of available data in 1955, with recent JRF analysis suggesting this is set to continue in this current Parliament. The period of stagnation started during the economic slowdown before the global financial crisis and persisted through the crisis itself, then austerity, Brexit, the coronavirus pandemic, and finally the cost of living crisis.
It is almost certain that economic stability is necessary to sustainably reduce poverty. However, economic growth on its own will not reduce poverty, and it is deeply unjust to force families to wait for economic growth before they feel their situation improve, especially given the picture of deepening poverty. Indeed, growing living standards and falling poverty could be a spur to growth: poverty imposes many constraints on decision-making, and can limit people’s propensity to take rewarding risks or plan for the future, holding back individual and national economic growth. Poverty will worsen a child’s development, educational attainment and future earning power.
5. Poverty has deepened
As mentioned earlier, in 2023/24, 6.8 million people — or almost half of those in poverty — were in very deep poverty, with an income far below the standard poverty line. Both of these statistics are the highest on record, going back to 1994/95. Almost twice as many (13 million people) had experienced very deep poverty in at least 1 year between 2019/20 and 2020/21.
In 2021–24, the average person in poverty had an income 29% below the poverty line, with the gap up from 23% in 1994–97. The poorest families — the growing group of people living in very deep poverty — had an average income that was 59% below the poverty line.
Figure 2: Since 1994/95, the percentage of people in poverty who are in very deep poverty has increased, and now makes almost half of people in poverty
Composition of poverty depth time-series
Source: Households Below Average Income, 2023/24, DWP
Our most recent Destitution in the UK report showed that around 3.8 million people experienced destitution in 2022, including around 1 million children (Fitzpatrick et al., 2023). These figures have more than doubled since 2017. We see further evidence of deepening poverty in the large increases in the number of people who are struggling to access enough nutritious and varied food. Among people in poverty, the number of people who are food insecure increased by 1.1 million between 2021/22 and 2023/24 (a 46% increase). Overall, the total number of people who are food insecure has increased by 2.8 million (a 60% increase in just 2 years).
6. Groups with unacceptably high rates of poverty
Families with children
We have already seen that children have higher risks of poverty overall (31% versus 21% for the whole population), but larger families with 3 or more children have consistently faced a higher rate of poverty (44% of children in large families were in poverty in 2023/24). This is because a number of benefit policies have a disproportionate impact on larger families. These include the 2-child limit, which restricted eligibility for many child-related benefits to the first 2 children in a family whether the family is in or out of work, and the benefit cap, which still limits the total income a household can receive in out-of-work benefits. Reductions in the poverty rate of children in large families drove child poverty downwards until 2012/13, but increases for this group have driven child poverty back up again since then. This is why scrapping the cap and the other measures in the Child Poverty Strategy are necessary conditions for reducing child poverty, but should be seen as a down payment towards progress rather than the complete package.
Families with children also face additional challenges if childcare responsibilities limit their ability to undertake well-paid and high-quality work (which again is a welcome part of the child poverty strategy), which is often the case for lone-parent families and families with younger children (as well as for larger families); 43% of children in lone-parent families were in poverty in the latest data — 2023/24 — as were 36% of children in families where the youngest child was aged under 5.
Minority ethnic groups
Poverty rates are very high for some minority ethnic groups. In particular, in 2021-24, over half of people in Bangladeshi (53%) and around half of people in Pakistani (49%) UK households lived in poverty, with even higher poverty levels for children in those households (65% and 60% respectively). Around 4 in 10 people in households headed by people from Black African backgrounds (40%) were in poverty, with around half of children in these households in poverty. All these groups were much more likely than people in households headed by someone of white ethnicity (18%) to be in poverty (24% of children in households headed by someone of white ethnicity were in poverty). Minority ethnic groups with higher rates of poverty also tended to have higher rates of very deep and persistent poverty.
Religion
New analysis of persistent poverty by religion suggests much higher rates of very deep poverty persistence for Muslim households (9%), with rates around 3 to 4 times that of households reporting no religion (3%) or Christian households (2%). We also see disparities for households headed by people born outside the UK (the closest available proxy for migrants), with 31% of people born outside the UK living in poverty, compared with 16% of those who are UK born, and around half of children in these families being in poverty.
Disabled people
Disabled people face a higher risk of poverty. This is driven partly by the additional costs associated with disability and ill-health, and partly by the barriers to work that disabled people face. However, the proportion of disabled working-age adults in work increased from 42% in 2010/11 to 53% in 2023/24, while poverty rates remained steady over that period. In the latest data, there were 17 million disabled people in the UK — that is, 1 in 4 people (24%) — and almost 4 in 10 families contained at least 1 person who was disabled. The poverty rate for disabled people was 28%, 8 percentage points higher than the rate for people who were not disabled. Half of all people who were disabled and living in poverty in the latest data had a long-term, limiting mental condition — around 2.4 million people. The poverty rate for this group was 34%, compared with 28% for people with a physical disability.
Informal carers
Similarly, informal carers are more likely than those with no caring responsibilities to be living in poverty (23% compared with 20%), although promisingly, that gap has closed in the latest data. In 2023/24, 1 in 10 adults (5.2 million) were informal carers, with 6 in 10 of these carers living in families where someone was disabled. Their reduced ability to work means informal carers face a financial penalty, with analysis in 2023 showing unpaid social-care givers experiencing an average pay penalty of £414 a month (nearly £5,000 a year).
People in workless households
People in workless households also face a higher risk of poverty, with more than half of working-age adults (53%) in workless households being in poverty, according to the latest data. However, because such a high share of the population is in work, around two thirds of working-age adults in poverty actually lived in a household where someone was in work, despite these households having a much lower poverty rate of 15%. The poverty rate for part-time working-age employees was nearly triple that of their full-time equivalents (22% compared with 8%), and part-time self-employed workers were more than twice as likely to be in poverty as all workers (28% compared with 12%). Workers in the accommodation and food services and administration and support activities sector had the highest poverty rate at 22%.
Social and private renters
There is also a link between tenure type and poverty. In 2023/24, around 4 in 10 social renters (40%) and over a third of private renters (37%) were in poverty after housing costs (AHC). Within this group of renters in poverty, around a quarter of social renters and 4 in 10 private renters were only in poverty after their housing costs were factored in and so appear to have been pushed into poverty by the amount of money they have to spend on housing. Among homeowners, around 1 in 7 (14%) people who lived in a home that was owned outright were in poverty, while 1 in 10 people living in a home being bought with a mortgage (10%) were in poverty.
People claiming income-related benefits
Finally, the poverty rates of people claiming different income-related benefits are much higher than the national average poverty rate. On the one hand, this is to be expected given the ‘low income’ eligibility criteria for claiming these benefits, but on the other hand, it demonstrates that benefit rates are frequently not sufficient to enable recipients to escape poverty. Indeed, the basic rate of Universal Credit is close to destitution thresholds.
7. Poverty across the UK
In the latest data, the average poverty rates in England (22%) and Wales (22%) have converged to around the same level, although poverty rates were lower in Scotland (20%) and much lower in Northern Ireland at 17% (note all country figures are averages of 2021/22, 2022/23 and 2023/24 data, as single-year figures can be volatile). These variations in poverty rates across the different nations of the UK are driven by differences in labour markets (including the levels of employment, the sectors worked in and rates of pay), housing markets (the mix of tenures and housing costs) and rates of benefit receipt, alongside wider demographic factors (age, family types and sizes). The greater reliance on renting and the higher costs of housing generally are substantial drivers of poverty in larger cities in particular, while lower rates of employment, with fewer employment opportunities alongside a greater concentration of employment in lower-paid roles and sectors, are more significant drivers across many post-industrial and coastal areas.
Child poverty rates in Scotland (23%) remain much lower than those in England (31%) and Wales (31%), similar to levels in Northern Ireland (24%). This is likely to be due, at least in part, to the Scottish Child Payment. This highlights the effect benefits can have in reducing poverty. Another driver of lower child poverty rates in Scotland and Northern Ireland are lower housing costs.
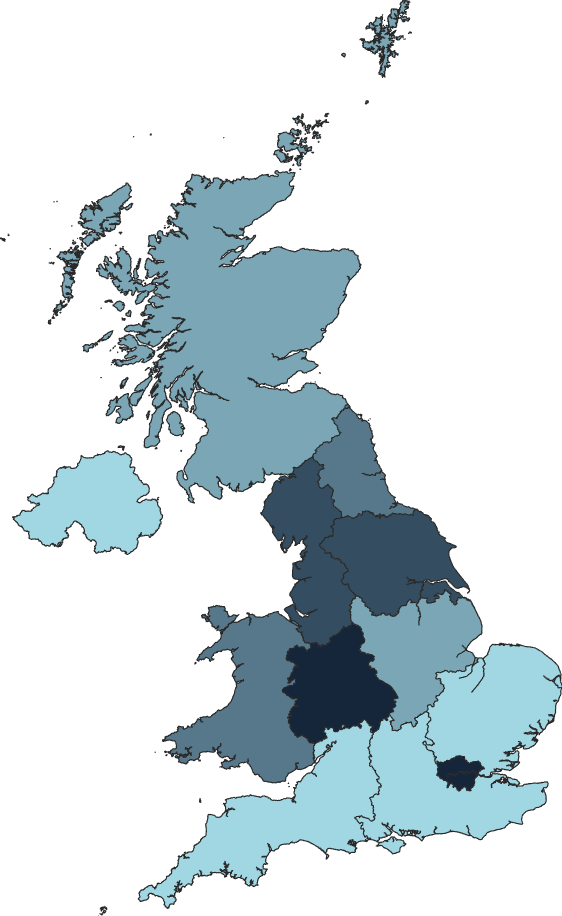
In the latest data, London had the highest rate of poverty at 26%, followed by the West Midlands (24%), North West (23%) and Yorkshire and the Humber (23%). In the West Midlands, North West, Yorkshire and the Humber, and North East, between 25% and 30% of working-age adults are not in employment, compared to around 20% in regions with the lowest levels of poverty (the East, South East and South West of England). The tenure mix and housing costs are major drivers of poverty in London. Almost half of people in London live in rented accommodation, while social and private renters in London pay significantly more on average in housing costs than those across the rest of the UK.
8. Future prospects remain deeply worrying
In October 2025, around 2.6 million of the poorest fifth of households (44%) were in arrears with their household bills or behind on scheduled lending repayments, 4.1 million households (69%) were going without essentials, and 3.2 million households (55%) had cut back on food or went hungry.
It is clear that the current economic situation is by no means positive, with all of the key drivers we look at either showing a negative or a mixed picture. The Office for Budget Responsibility (OBR) forecasts rising rates of inactivity and earnings growing only slowly. The increase in the Universal Credit basic rate is welcome, allowing at least a little of the extensive ground lost through the cost of living crisis and beforehand through benefit freezes to be made up, but it is coupled with a cut to benefit levels for people who are newly sick, and the basic rate of benefits continues to be around the threshold for destitution. When all this is combined with increasing housing costs and frozen levels of housing support, the prospects for falling poverty and rising living standards for people struggling to make ends meet is bleak, especially for families without children.
9. What can be done?
The Child Poverty Strategy represents a good start towards progress on reducing poverty, but we need the Government to widen its poverty perspective beyond children and to think more systematically about the causes and consequences of poverty for everyone who is affected, all of whom will be worrying about how to make ends meet and are being prevented from thriving. The bottom line is we need to redesign the relationship between economic policy, labour markets, public services, and social security so that:
- income growth is fairly distributed
- essentials are affordable
- shocks do not disproportionately hit low-income households
- investment in financial security for households is seen as a foundation for economic growth.
To look at specifics, the key actions we set out last year remain those that we at JRF think can be taken across critical areas to move the dial on poverty and hardship:
- improve financial protection for people at work, or if they lose their jobs or cannot work for a period, such as paid leave due to caring demands or sickness, building on new policies which have started to raise the basic level of workplace rights and protections. This should include extending support to self-employed people to cover periods where they are unable to work or are on a low income
- give people the ability to care alongside work without falling into hardship, including by increasing the value of carer benefits, particularly for carers on low incomes, while making paid care services more affordable and accessible for those with low to median incomes and savings
- ensure social security is there for all of us when we need it, with the basic rate set so it is at least enough to afford life’s essentials. This includes permanently re-linking the Local Housing Allowance to local rents and introducing a protected minimum floor in the benefit system, alongside forging a ‘social safety net’ of crisis support, practical help and social connection where people live
- help people accrue modest savings, access affordable credit, gain relief from problem debt, and hold assets (especially those without access to family wealth)
- expand access to affordable, secure, decent homes, whether rented or owned, by increasing the supply of homes, including those for social rent
- work closely with devolved governments where powers overlap to make services as easy as possible to access, and collaborate on shared priorities, such as supporting individuals into work.
This report makes it very clear that levels of poverty and hardship in the United Kingdom are unacceptably high. We have given here a list of concrete actions to address hardship. We need the Government to push on from the Labour manifesto commitments which agreed to ‘develop an ambitious strategy to reduce child poverty’ and to ‘end mass dependence on emergency food parcels’, as well as to ‘review Universal Credit so that it makes work pay and tackles poverty’ (Labour, 2024), towards targeted action that meets the urgency of the moment.
With the scrapping of the 2-child limit in the benefit system as well as the wider measures in the Child Poverty Strategy, we finally have an indication that the Government are willing to take positive steps at sufficient scale. We at JRF strongly believe that there needs to be a more holistic plan that addresses a much wider range of causes and consequences of poverty across all who are held back by hardship. This needs to see improvements in living standards for people in poverty as something that will help us secure higher growth, rather than being merely dependent on it. Until this happens, people will continue to struggle to stay afloat, being dragged further and further into deeper and deeper poverty, with the huge personal and national suffering we demonstrate here.
Note
The main survey we use to build up our latest understanding of levels of poverty will be going through significant changes in the coming years, and we expect much of the data we present here to be revised once this happens. The end destination will be a more robust set of statistics, but in the interim, we will have to exercise some caution when describing what the latest pictures are with respect to poverty levels in the UK. See Annex 5 for details.
Appendix
Joseph Rowntree Foundation (2026) UK Poverty 2026 PDF
Acknowledgements
Authored by: Taha Bokhari, Carla Cebula, Joseph Elliott, Christine Ellison, Scot Hunter, Francisca Ladouch, Peter Matejic, Nik Percival, Sam Tims, and Andrew Wenham.
Reviewed and edited by: Pinnacle Graphic Design Ltd, Westchester Publishing Services UK, JRF Insight and Policy, and Communication and Public Engagement teams.
Project co-ordination and management: Helena MacDonald.
Communications and engagement work: JRF Communication and Public Engagement teams.
How to cite this report
If you are using this document in your own writing, our preferred citation is:
